Node Status Display
Once you have completed the initial setup on your AREDN® node, you can connect your computer to the LAN port on the PoE and navigate to the following URL: http://localnode. You will be redirected to the Node Status page as shown below.
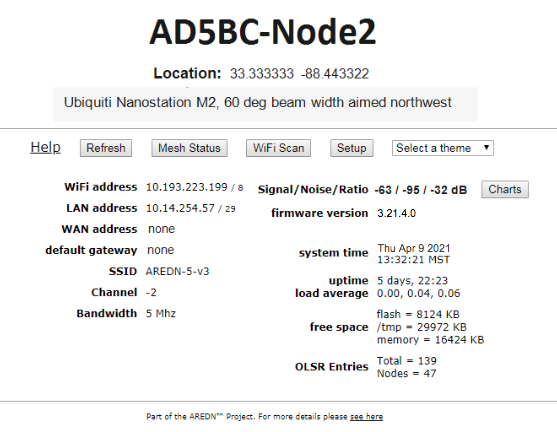
Below the node name bar there are several controls.
- Help
Opens a new window or tab to display the node help page.
- Refresh
Updates the Node Status page with current data.
- Mesh Status
Opens the Mesh Status page showing the neighbor nodes and remote nodes visible on the mesh network, as well as what services are being provided by those nodes.
- WiFi Scan
Displays a list of other 802.11 signals that your node can see. The 802.11 signals may include Access Points, neighbor nodes, and other mesh networks (foreign ad-hoc networks). WiFi Scan only finds devices on the same channel width as your node is configured to. When installing at a new location, it is best practice to scan on 5, 10, and 20MHz channels to find all 802.11 signals in range. This information will help to pick a channel clear of other interference. When multiple ad-hoc networks are visible (with different SSIDs or channels), the ID of each 802.11 ad-hoc network is displayed but not the individual nodes. There is also an automatic scan mode, but running a Wifi Scan continuously is not recommended, particularly if the node is actively routing traffic. The scan is passive, or only listens for other beacons through all channels, and risks loss of data on the assigned channel. Wifi Scan does not transmit probes on every channel in passive mode, thus no risk of interfering with Radar stations on DFS channels, or other unintended transmissions. Multiple attempts of Wifi Scan will be necessary to find all devices in range.
- Setup
Navigates to the Setup pages for your node. You will need to supply a username and password to access those pages. The username is always
root, while the password is the one you set during initial node setup. If the node has not yet been configured, the password ishsmm.- Select Theme
AREDN® firmware has several built-in display themes. The default
aredntheme has a gray background with black and red text. Theblack_on_whitetheme is often chosen because it provides the best screen contrast on a computer exposed to direct sunlight.red_on_blackis much better suited for nighttime use since it helps preserve night vision.
Node Settings Summary
The area under the display controls shows both configuration and network status information. The left column contains the IP address details for the network interfaces on this node, as well as the SSID, channel, and bandwidth settings.
The right column contains the Signal Strength readings and other attributes of your node. The Signal/Noise/Ratio shows the strongest neighbor radio signal strength in dBm from all connected stations, and it is available only when the node is connected by RF to a mesh network. Click these links for further information about Signal to Noise Ratio and values measured in decibels.
Below the Signal Strength readings are the node’s Firmware Version and network type. The System Time is displayed, as well as the Uptime, or time since the last reboot. Nodes have no internal battery or realtime clock, so the time is reset every time the node is booted. If an Internet connection becomes available, the internal NTP client will connect with a time server to sync the node’s time.
The Load Average is the average number of processes that have been running on the node for the last 1, 5, and 15 minutes. Free Space tells you how much space is available on local storage devices. Flash is the internal non-volatile storage where the operating system, configuration files, and software packages are kept. /tmp is a filesystem in memory that stores the node’s current status and various temporary files. Memory is the amount of RAM available for running processes on the node.
The OLSR Entries show the total number of entries in the routing table, as well as the number of nodes currently connected to the mesh network.
AREDN® Alert Messages
The AREDN® development team has the ability to post messages which Internet-connected nodes will automatically retrieve once every 12 hours. There are two types of messages: broadcast messages intended for all nodes, and directed messages which are only retrieved by individual nodes. Messages are displayed in a yellow banner on a node’s webpages above the node name. Be aware that there is no guarantee of privacy for these messages, since anyone can view the message repository online.
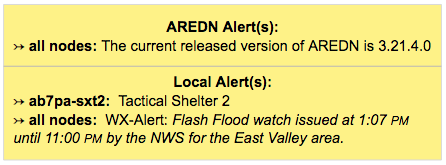
Mesh nodes without Internet access also have the ability to display Local Alerts. The process for setting up a local message repository is described in the Configuration Deep Dive section. If a node has Internet access as well as local messages, then both types of messages will be displayed in the AREDN® alerts banner as shown in the example above.
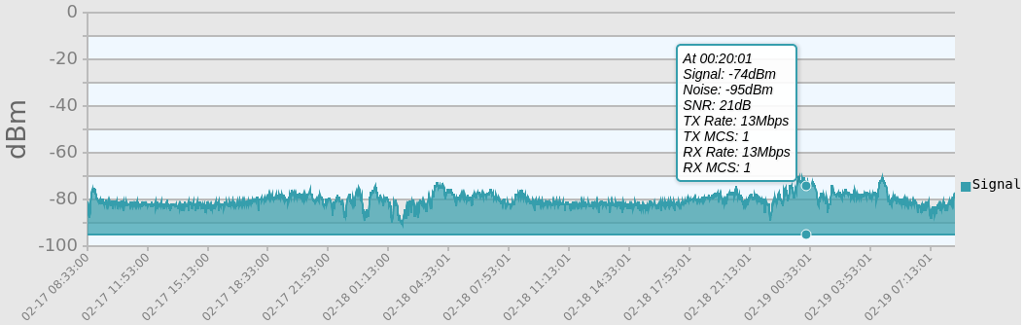
Signal Charts
There is a Charts button next to the node’s Signal Strength display, and clicking this button takes you to Signal Charts. This page shows RF signal information in both a realtime and an archived view. The default view shows the average signal of all connected stations in realtime.
At the top of the charts display there are several control buttons.
- Archive
This button shows the charts for any archived signal data on this node.
- Realtime
This button shows the charts for current signal data as seen from this node.
- Quit
This button exits the charts view and takes you back to the Node Status page.
Below these controls you can choose to view the signal strength statistics for individual nodes that are directly connected to your node. Choose the neighbor node from the Selected Device dropdown list. Changing the selected device will automatically reload the chart to show that node’s information.
Hovering over data points within a chart will show additional information for each data point, including Time, Signal, Noise, SNR, TX Rate, TX MCS, RX Rate, and RX MCS. If no traffic is being routed to the neighbor, the Rate and MCS values may be zero until data is available. An MCS value of zero may indicate non-802.11n encoding schemes (ie. 802.11a/b/g).
The small icon with three vertical dots in the upper right corner of the chart allows you to download a snapshot of the chart to a graphic file on your local computer (jpeg or png).
Data shown in the Archive charts is not stored in permanent memory on the node. The node will store approximately two days of archived data, and all data is cleared when a node is rebooted.
If you click and drag your mouse across a region of the chart, the display will zoom into that selected area. This allows you to view data points for a specific time range of your choice. While zoomed, two additional icons will appear in the upper right of the chart. The Pan icon allows you to scroll and pan the zoomed portion of the chart. The Reset icon returns the chart to its normal display mode.
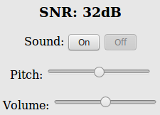
On the left of the Realtime Graph there is an SNR Sound control. Clicking the On button will cause your computer to emit a tone that corresponds to the relative SNR level, with higher pitch tones indicating better SNR. This feature was added in order to provide an audio queue to operators in the process of aligning directional antennas. When your antenna reaches a position at which the highest pitch tone is heard you can lock it down without having to look at the signal graph display, knowing that you are receiving the best signal available. You can also adjust the tone pitch and volume with the sliders on the sound control.