Node Status Display#
Once you have completed the initial setup on your AREDN® node, you can connect your computer to a LAN port on the device or the PoE and use a web browser to navigate to the node status page.
http://localnode.local.mesh or http://<your-nodename>.local.mesh
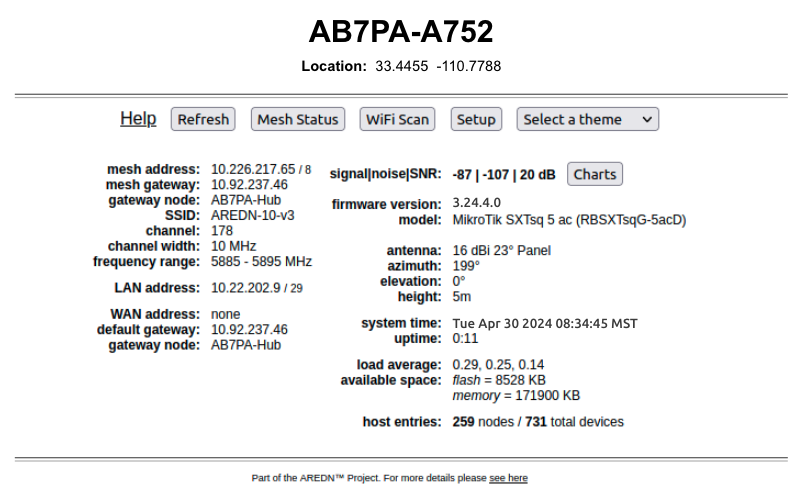
This display has been designed to present all of the important information about your node in one view. Someone navigating to your node’s status display will be able to see all of the key elements of interest without having to click to multiple pages. This display consists of a top navigation bar, a left navigation bar, and typically shows three columns of information about your node. The information is displayed adaptively based on the width of the browser or screen you are using. If you are using a narrow display such as a smartphone or tablet, the information may be shown in a single column. If you are using a width-limited display, the information may be shown in two columns. On wider displays the information will be shown in three columns (as depicted above).
Top Nav Bar#
The AREDN® logo is displayed in the upper left corner. If you click the AREDN® logo you will be taken back to localnode.local.mesh. After the AREDN® logo, the node name is displayed along with a label indicating whether you are viewing the status or admin display. On the far right is the user status icon.

The default icon indicates that you are viewing the page as a normal user. Clicking this icon will open a dropdown menu that allows you to login as the node administrator.
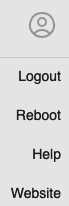
If the user icon is displayed within a circle, then you are viewing the page as the node administrator. Clicking this icon will open a dropdown menu that allows you to logout, reboot the node, display help, or open the AREDN® website.
Left Nav Bar#
Using the icons on the left side bar you can navigate to various displays.
 navigates to this node status display.
 navigates to the local mesh status page showing the nodes visible on the local mesh network, as well as any services provided by those nodes.
 navigates to the Cloud Mesh view through the Supernode network (if your local network has a Supernode). For more information, see Supernode Architecture in the Network Topologies section of the Network Design Guide.
 navigates to the world map on the AREDN® website. This is only displayed if your node has valid latitude and longitude values, since this feature is designed to display your node in the center of the map. If your node has no latitude and longitude values, then this icon will not appear on the nav bar.
Left Section#
Several sections of node information are presented here (listed from top to bottom).
- Node Description
This is not a required field, but node owners typically use it to list their contact information or the tactical purpose for the node.
- Node Time, Uptime, Load Average, and Free Memory
The node time is displayed and if an NTP or GPS time source is available, that source will be displayed in parentheses. If an Internet connection or a local NTP server is available, your node’s NTP client will sync its time with that source. If a local GPS source is available, your node can use that source.
The
uptimeis also displayed, which is the time since the last reboot.loadis the average system utilization for the last 1, 5, and 15 minutes.free flashandfree ramshows how much storage space is remaining on your node.flashis the internal non-volatile storage where the operating system, configuration files, and software packages are kept.ramis the amount of RAM available for running processes on the node.- Firmware Information
This displays the node’s current firmware version. A badge on the right indicates the status of the firmware, with valid values including
Up to date,Update available, andCustom. If your node has access to the Internet you can also click the issues label below the firmware version, and this will open the AREDN® Issues page on GitHub. Clicking the release notes label will open the Changelog page on the AREDN® website.- Network Information
The Mesh IP address/netmask is displayed using CIDR notation, followed by the LAN IP address/netmask. If the WAN interface is enabled, the WAN IP address/netmask is displayed along with whether this address was obtained via DHCP or assigned as a static IP address. The WAN gateway IP address is also displayed.
- Node Location Information
At the bottom of the left column is the node location information. Initially there will be no location values since the latitude, longitude, and grid square have not yet been entered. After the latitude, longitude, and grid square have been entered (as described in the Node Admin guide), your node will attempt to display a thumbnail map with its location in the center. If your node has no access to the Internet or to a local map tile server, then the map will not be displayed. The latitude, longitude, and grid square values will be shown below the map thumbnail.
Center Section#
The center column has four main sections (listed from top to bottom).
- Local Services
This section displays the service links for any mesh services on your node or its locally-connected devices. These service links are displayed side by side in two columns. Clicking any of the links will navigate to the selected service.
- Local Devices
This section displays any devices that are directly connected to your node. This includes devices that are connected to your node’s LAN via Ethernet cable (such as VoIP phones, IP cameras, or service computers). Be aware that DHCP devices with Do Not Propagate checked will not be displayed.
- Local Nodes
This section displays any local DtD nodes that are directly connected to your node, typically via Ethernet cable. If you hover the cursor over the node name, a popup will appear showing the relative link quality of the connection to that node. Clicking the node name will navigate to that node’s status page. For Local Nodes the snr, nsnr, mbps, and distance columns will always be blank.
Basic Link Quality Metrics
Several link quality statistics can be displayed for different types of connections that are mentioned below. Before introducing those link types, here is a brief explanation of the link quality metrics that may be displayed if they are available.
rxor receive success rate shows the percent of packets received based on what was expected.rttis the round trip time or “two-way delay” which shows the link latency between two nodes.snror Signal-to-Noise Ratio is expressed in decibels (dB). This metric only applies to RF links and represents the level of signal which is detected above the noise floor. SNR is shown for both sides of a radio link (snr and n snr).errorsis calculated as the moving average of (total sent packets) divided by (total sent packets plus retransmissions) and expressed as a percent. For example, if the node had to send every packet twice for it to be successfully received, the error rate would be 50%. An additional penalty is subtracted if the neighbor node is unpingable.mbpsis a rolling average of the data rate achieved across any radio (RF) link. This column may show zero if the data being transmitted between these nodes is not sufficient for the metric to be calculated.distis the line of sight distance between your node and the remote node, calculated from the GPS coordinates if they are entered for both nodes. This value will be expressed in miles or kilometers based on the locale settings in the web browser.
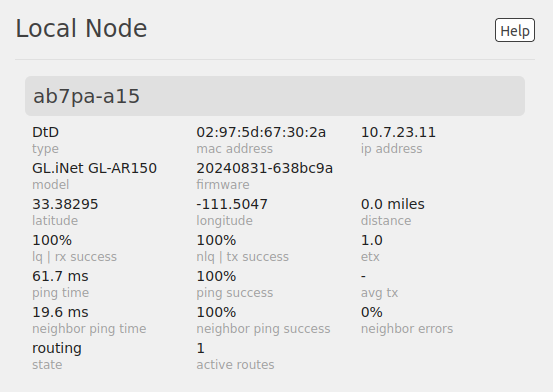
When you hover over the row of any Local Node, a gray background appears which indicates that row is selected. If you click in the selected row (but not directly on the node name link), the Local Node popup will be displayed which provides more detailed information about your node’s connection to the selected node.
- Neighborhood Nodes
This section displays any nodes that are direct neighbors of your node, whether via RF, an xlink, or a tunnel over an Internet connection. Each type of connection will display a different icon to the right of the node name, and this indicates the type of link (for example, the small radio signal icon in the screenshot above indicates an RF link). If a node is reachable from your node, you can click the node name to navigate to that node. Not all the columns for link quality statistics will be populated for Neighborhood Nodes. If you hover the cursor over the node name, a popup will appear showing the relative link quality of the connection to that node.
Node Status Indicators
For nodes in the Local Nodes and Neighborhood Nodes sections, different colors, styles, and hover text may be displayed based on the quality of the connection to each node.
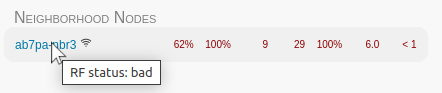
In the example above, the node name and statistics are displayed in red, and hovering over the node name displays status text indicating that the RF status is “bad”. Status colors may vary based on the display theme you have chosen. The following list shows how the standard theme text colors are mapped to link quality.
- green:
excellent
- dark green:
good
- blue:
okay
- orange:
poor
- red:
bad
- gray:
idle or hidden
- strikethrough:
blocked
If hidden nodes are detected which your node cannot reach for some reason, they will be displayed in a subsection labeled Hidden Nodes. For more information about hidden nodes, see Hidden and Exposed Nodes in the Channel Planning section of the Network Design Guide.
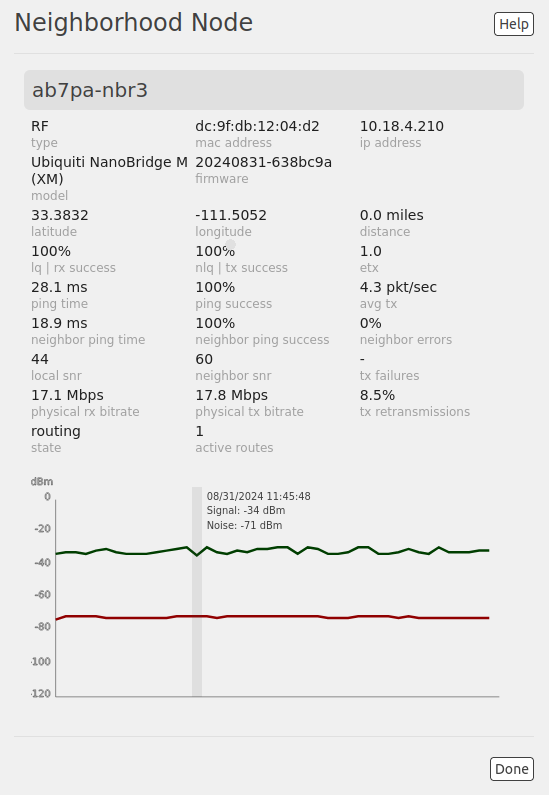
When you hover over the row of any Neighborhood Node, a gray background appears which indicates that row is selected. If you click in the selected row (but not directly on the node name link), the Neighborhood Node popup will be displayed which provides more detailed information about your node’s connection to the selected node.
- Node Icons
Each node in Neighborhood Nodes list may have an icon that indicates its status.
 indicates an RF link
 indicates a tunnel link
 indicates a DTD link
 indicates a Cross-link
Right Section#
The right column displays additional details about your node (listed from top to bottom).
- Radio section
Your device manufacturer and model are displayed at the top of the column. If a radio is configured as a
Meshradio, you will see the channel number and frequency range, followed by the channel width (in MHz). Next is the transmit power (in dBm), the actual maximum distance limit (in miles or kilometers) calculated by the radio, and the minimum snr (in dB) for communication with other RF nodes.Note
The
maximum distance (actual)value is pulled from the radio’s kernel, so it is the real value in use by the radio. Some radios, typically the indoor desktop devices, do not allow this value to be changed and will always report a fixed value or possibly zero.If a radio is configured as a
LAN Hotspot, you will see the channel number and the SSID that wifi clients can use to connect to your node’s hotspot. If a radio is configured as aWAN Clientyou will see the SSID of the wifi AP to which your node connected, as well as the status of the connection (no connection, connected but no internet, connected with internet). Your node’s antenna information is listed next, including the type of antenna, the azimuth, height above ground level, and tilt angle / elevation (if directional).- Mesh section
Next there are summary statistics showing how many nodes, devices, and services are currently visible from this node.
- LAN DHCP section
By default each node runs a DHCP server which is capable of automatically providing IP addresses for any LAN-connected devices. This section shows the DHCP server status, the IP address/netmask of your node functioning as the gateway for its LAN-connected devices, and the IP address range served by your node. It also shows the number of active leases and IP addresses reserved for specific devices on its LAN. In addition, counts are displayed for the number of DHCP tags and options that are defined on your node.
- Ethernet Ports & Xlinks
If you have a multiport node or one which supports xlinks, then the Ethernet Ports & Xlinks section will be displayed. This shows the number of Ethernet ports on the device, as well as how many of them are actively in use. You will also see the number of xlinks that you have defined on this node.
- Tunnels section
This section displays statistics on any tunnel connections you may have on your node. Counts are displayed for active / allocated tunnel client connections as well as for active / allocated tunnel server connections on your node.